by Joyce Miller
The first step in characterizing the seafloor is to make a map of the bathymetry (seafloor depths) and seafloor characteristics, such as hardness and roughness. For this project we are using a multibeam sonar – an instrument that sends multiple “beams” of sound to the ocean floor and precisely measures the time that it takes for the sound to travel from the sonar to the seafloor and back to the sonar (the speed of sound in water is approximately 1500 m/sec, and from this number and the time we can calculate the depth of the seafloor).

(Image from Coast Survey website. http://www.nauticalcharts.noaa.gov/
Student exercise: If it takes 1 second for the sound to travel from the sonar to the seafloor and back, how deep is the seafloor? If it takes 0.1 sec, how deep is the seafloor?
(Answer: At 1 second, the water depth is 750 m, because you must divide by 2 for 2-way travel time. At 0.1 second, the water depth is 75 m.)
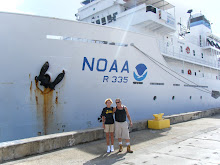
The system we are using is a Reson 8101ER sonar that is mounted on a sturdy pole on the side of the Oscar Elton Sette. Because the ship moves in three dimensions, we also use a very precise motion sensor (the Applanix POS-MV) to measure the ship’s pitch, roll, heave, heading, and position. When the motion measurements are combined with the measurements from the multibeam, it is possible to measure the depth of the seafloor quite accurately.
\

The pole mounted sonar is lowered to a vertical position and the transducer is below the bottom of the ship during operation of the multibeam sonar.
The Reson 8101ER operates at a frequency of 240 kHz or 240 cycles per second, which is the frequency that is best suited for the 0-300 m depth range in which are working during this cruise. (Note: For scientific studies such as mapping, measurements are done in meters. However, United States nautical charts are still published in feet and fathoms!)
Student Exercise: What is the range of the Reson 8101ER sonar in feet? In fathoms?
(Answer: 0-300 m = 0-984.25 ft = 0-164.04 fm)
The 8101ER sonar has a total of 101 beams, which give us 101 depths each time the sonar “pings” or sends out sound. Depending upon the seafloor depth, the sonar pings somewhere between 30 times per second in water depths of less than 10 m and 2 times per second at its maximum range of about 300 m. The 101 beams create a swath that is perpendicular to the course of the ship (athwartship); the swath width is approximately 5 times the water depth up to a maximum width of the 300 m range.
Student Exercise: Calculate the number of depth readings you would collect in one day if the sonar were pinging at 30 times per second. At 2 times per second? Do you collect more data in shallow water or deep water? How much computer storage space do you think it takes to save all of these data points? At a depth of 30 m, what would be the swath width of the sonar?
(Answer: At 30 times per second (30x60x60x24), you would collect 2,592,000 depth readings in one day; at 2 times per second (2x60x60x24) 1,728,000 depths readings per day. We collect more data in shallow water because we ping more frequently. We typically collect about 2 Gigabytes of data per day, but this varies depending upon water depth. The swath width at 30 m depth would be 150 m (30 x 5).
The first operation of the cruise was to work for about 2 ½ days to complete a map of Galvez Bank, south of Guam. The bathymetry map was completely processed by the scientists aboard the ship and made available to the BotCam, BRUVs, and AUV crews to plan their work.

Below: Map of Galvez Bank created using multibeam data gathered during this trip.

NOAA and University of Hawaii scientists have been collecting bathymetric and optical data in the Mariana Archipelago since 2003 and all data collected through 2008 can be downloaded from the Pacific Islands Benthic Habitat Mapping website. http://www.soest.hawaii.edu/pibhmc/pibhmc_cnmi.htm
The Galvez data will be added to an on-going project to combine all of the data collected in the Mariana Archipelago that have been collected by NOAA, the Naval Oceanographic Office, a number of universities, and other countries, which was presented in a 2007 poster.
Another product of seafloor mapping is information about the character of the seafloor that can be obtained from the electronic signal imbedded in the multibeam data, which is called “backscatter” data. The size and character of the electronic signal gives us clues about the hardness and roughness of the seafloor. In this draft backscatter map of Galvez bank presented here, the lighter shades indicate either smoother or softer seafloor, while the darker shades show either rougher or harder seafloor. As the work on this cruise progresses and more video and photographic data are collected about the character of the seafloor, we will be better able to interpret the backscatter information to create a benthic habitat map.
Student Exercise: Do you think mud or coral would send back a larger acoustic return? Do you think mud or coral would send back a “rougher” acoustic return?
Additional maps of Galvez Bank will be created from the bathymetry and backscatter data as the work progresses. These include slope, rugosity (roughness), feature maps called Bathymetric Position Index or BPI, and hard/soft maps. Examples of such maps for French Frigate Shoals, a coral-rich bank in the Northwestern Hawaiian Islands, are available from the PIBHMC website.

